CoreDash About
Built by a performance consultant who needed better tools. Now used by the teams behind Nestlé, eBay, DPG Media, and Harvard.
Why CoreDash exists
CoreDash started because the existing RUM tools were not built for the way performance work actually happens. Too many dashboards prioritize surface level scores over diagnostic depth. They sample data, cap URLs, gate features behind enterprise pricing, and leave you waiting 28 days for CrUX to confirm what you already suspected. CoreDash was built to close that gap.
After years of auditing enterprise sites and relying on tools that made the job harder than it needed to be, Arjen Karel built CoreDash as the platform he wanted to use in the field. Real time attribution for every Core Web Vital. Full segmentation across every dimension. No artificial limits. Every metric measured the same way Google measures it.
Today, CoreDash is used by performance teams at some of the largest sites in Europe and beyond. The same infrastructure that powers enterprise audits across millions of pages is available to any team that cares about Core Web Vitals.

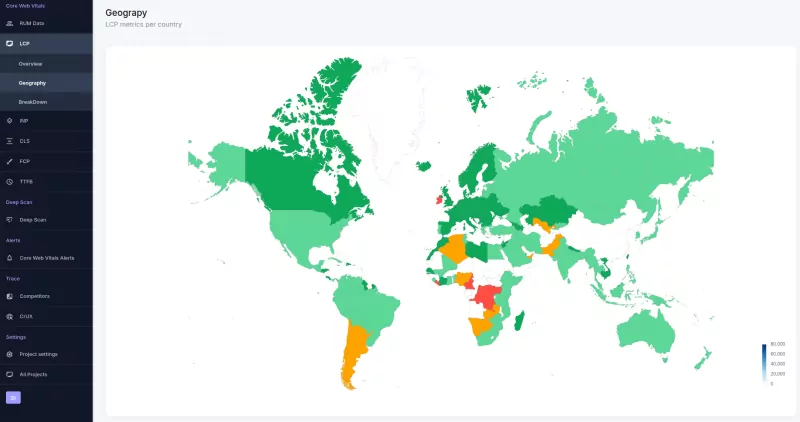
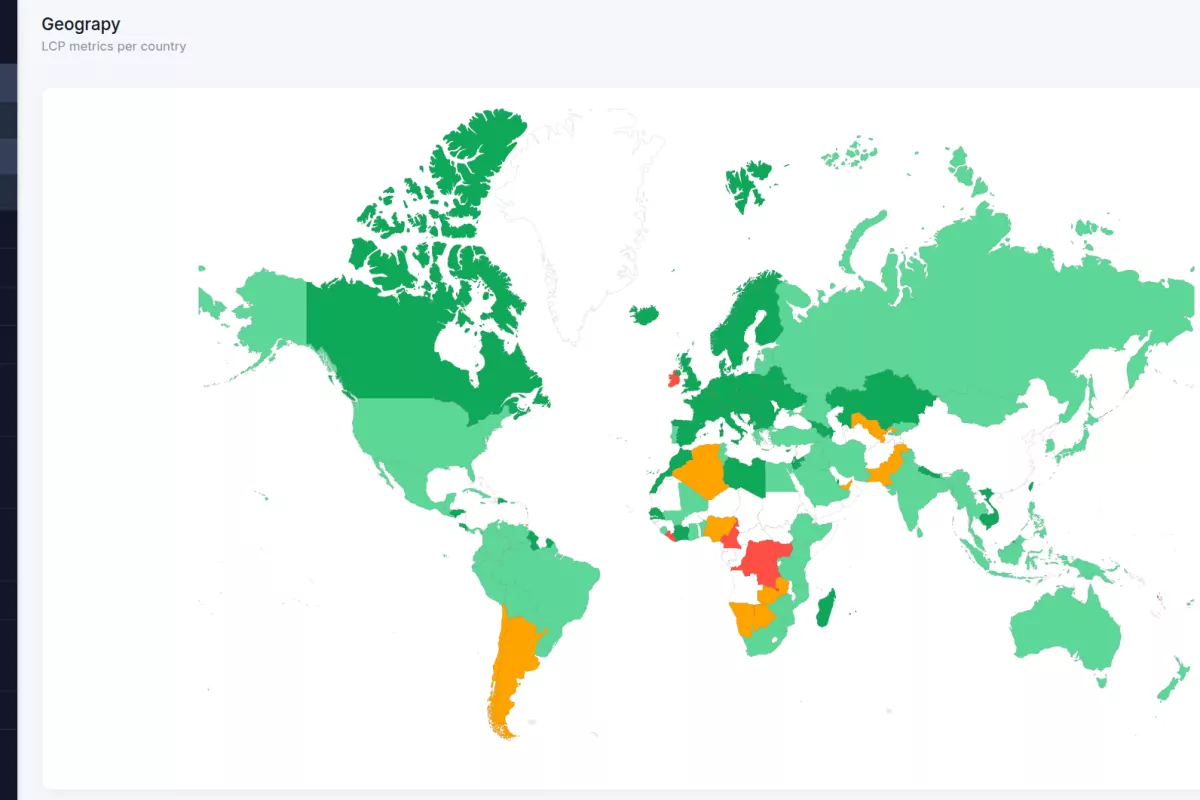
The geographic view shows how real users experience your site across regions. Use it to audit your CDN strategy, identify where network latency degrades the experience, and validate that infrastructure changes have the intended effect.
What drives the product
- Measure what real users experience. Lab scores tell one story. Real users on variable 4G connections with budget phones tell another. CoreDash captures high fidelity field data directly from the browser using the PerformanceObserver API. You optimize for actual conditions, not simulated ones.
- Focus on the distribution, not the average. The p75 and the long tail reveal where the real experience lives and where revenue loss occurs. CoreDash gives you the full distribution across every metric so you can find the segments that need attention, not just celebrate the median.
- Never become the bottleneck. A monitoring tool that slows down your site defeats its own purpose. The CoreDash collector is under 2KB, fully asynchronous, and passively listens to browser APIs without blocking the main thread. Zero impact on the experience you are trying to measure.
Privacy by design
CoreDash collects no personal data and requires no cookies. All data is processed and stored exclusively in the EU. That means full GDPR compliance without consent banners and without losing pageviews to cookie opt outs. You measure 100% of your traffic.
AI native
CoreDash ships with a Model Context Protocol (MCP) server. Connect Claude, Cursor, or any AI agent directly to your live Core Web Vitals data. AI can analyze trends, identify regressions, and surface recommendations using the same real user data you see on your dashboard.

