Core/Dash Understanding the Metric Breakdown Dashboards
Root Cause Analysis. Dissect composite metrics into their fundamental parts to identify the exact source of latency.
Understanding the Metric Breakdown Dashboard
Composite metrics like LCP and INP aggregate multiple distinct timing events. Optimizing the total score requires isolating these underlying components. The Metric Breakdown dashboard dissects performance into granular phases to identify the specific bottleneck.

This tool replaces broad optimization with precise engineering targets. It attributes latency to the server, network, or client execution.
Anatomy of the Breakdown Dashboard
The dashboard provides three synchronized views to isolate the root cause of latency:
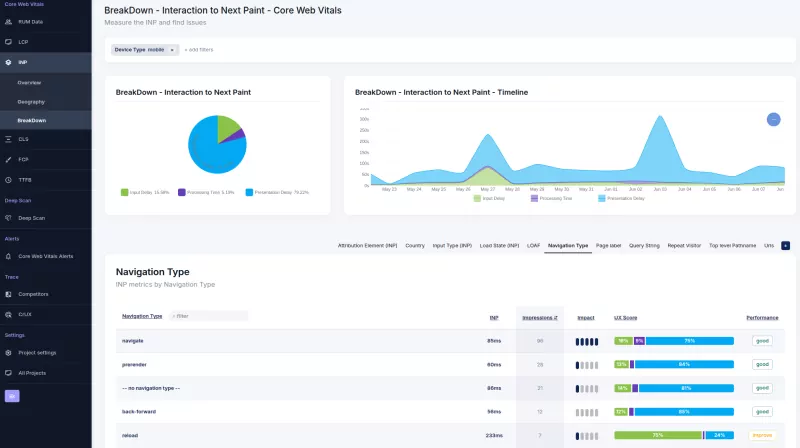
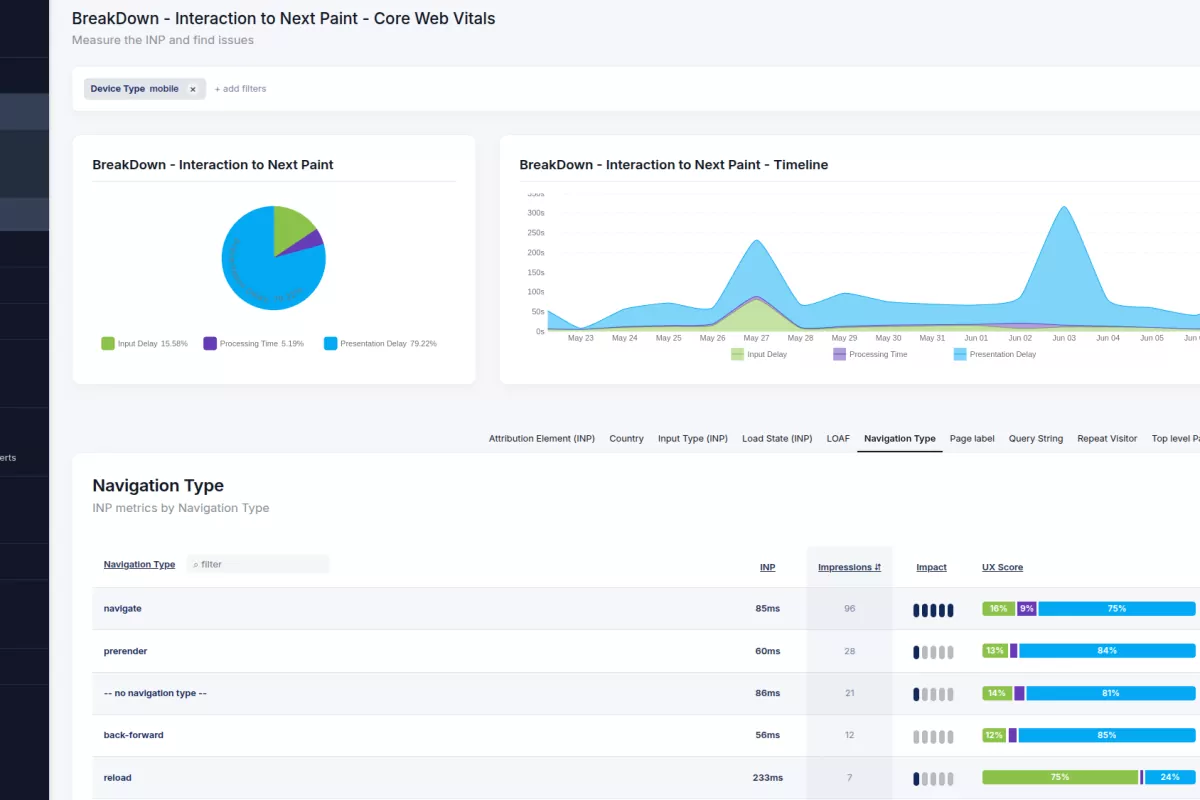
- Contribution Donut: Visualizes the relative weight of each sub-part. It answers the question "What is the biggest factor?" If `Time to First Byte` takes up 70% of the chart, you know the issue is backend related.
- Historical Timeline: Trends the absolute values of each component over time. Use this to correlate performance shifts with specific events like deployments.
- Segmented Data Table: Breaks down the metric by dimension (URL, Device, etc.). Each row includes a distribution bar that reveals the unique profile of that segment, helping you spot outliers.
LCP Components (Largest Contentful Paint)
LCP measures load performance. We split this metric into four phases:
- TTFB (Time to First Byte): The server response time. High TTFB indicates slow database queries or lack of edge caching.
- Load Delay: The gap between the initial HTML response and the start of the LCP resource download. This measures resource discovery latency.
- Load Time: The duration required to download the LCP asset (image or font) over the network. This correlates with file size and bandwidth.
- Render Delay: The time between the resource finishing download and painting to the screen. High Render Delay often indicates main thread blocking by JavaScript.
TTFB Components (Time to First Byte)
TTFB serves as a proxy for server responsiveness. This breakdown isolates network connection phases:
- Waiting: The time the browser spends waiting for the server to generate a response (Backend processing).
- Cache: Time spent checking local or intermediate caches.
- DNS: The duration of the Domain Name System lookup.
- Connection: Time taken to establish the TCP connection.
- Request: Time taken to send the HTTP request headers.
INP Components (Interaction to Next Paint)
INP measures interactivity. We segment the interaction lifecycle to pinpoint main thread blocking:
- Input Delay: The time between user interaction and event handler execution. High Input Delay means the main thread was busy.
- Processing: The time taken to execute the event callbacks. This represents the efficiency of your JavaScript logic.
- Presentation: The time taken for the browser to calculate layout and paint the next frame.
Diagnostic Workflow
Follow this sequence to diagnose a regression:
- Quantify the Bottleneck: Look at the Donut chart to find the dominant sub-part. If `TTFB` is high, check your server. If `Resource Load Delay` is high, check your asset priority.
- Establish Causality: Check the Timeline to correlate the spike with a specific deployment or content update.
- Isolate the Context: Use the Data Table to see if this pattern holds true across all pages or if it is specific to a certain template. Finding the pattern is key to deploying a scalable fix.
Optimizing Core Web Vitals
Use these breakdowns to route tickets to the correct engineering team. Assign TTFB issues to Backend. Assign Load Delay and Render Delay to Frontend. Assign DNS/Connection latency to Infrastructure. This streamlined triage process reduces investigation time and accelerates resolution.

